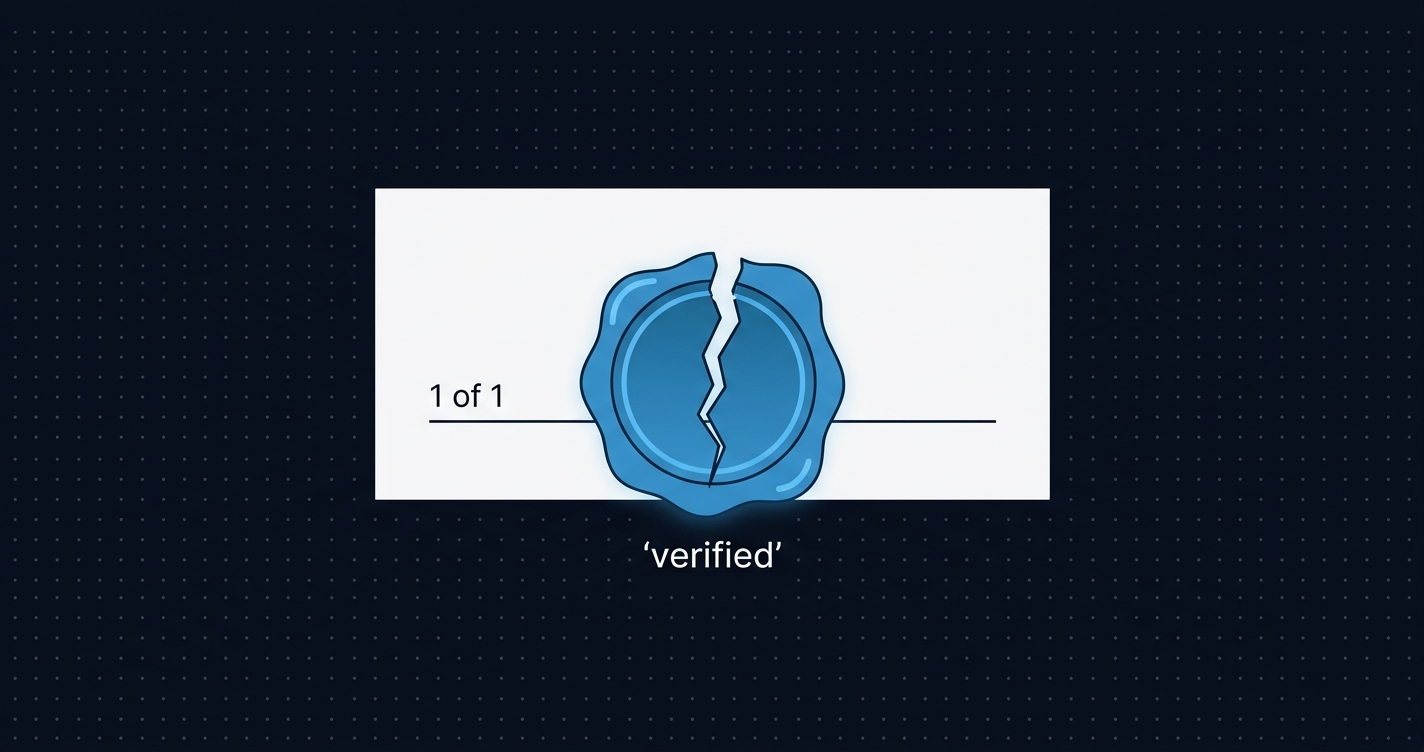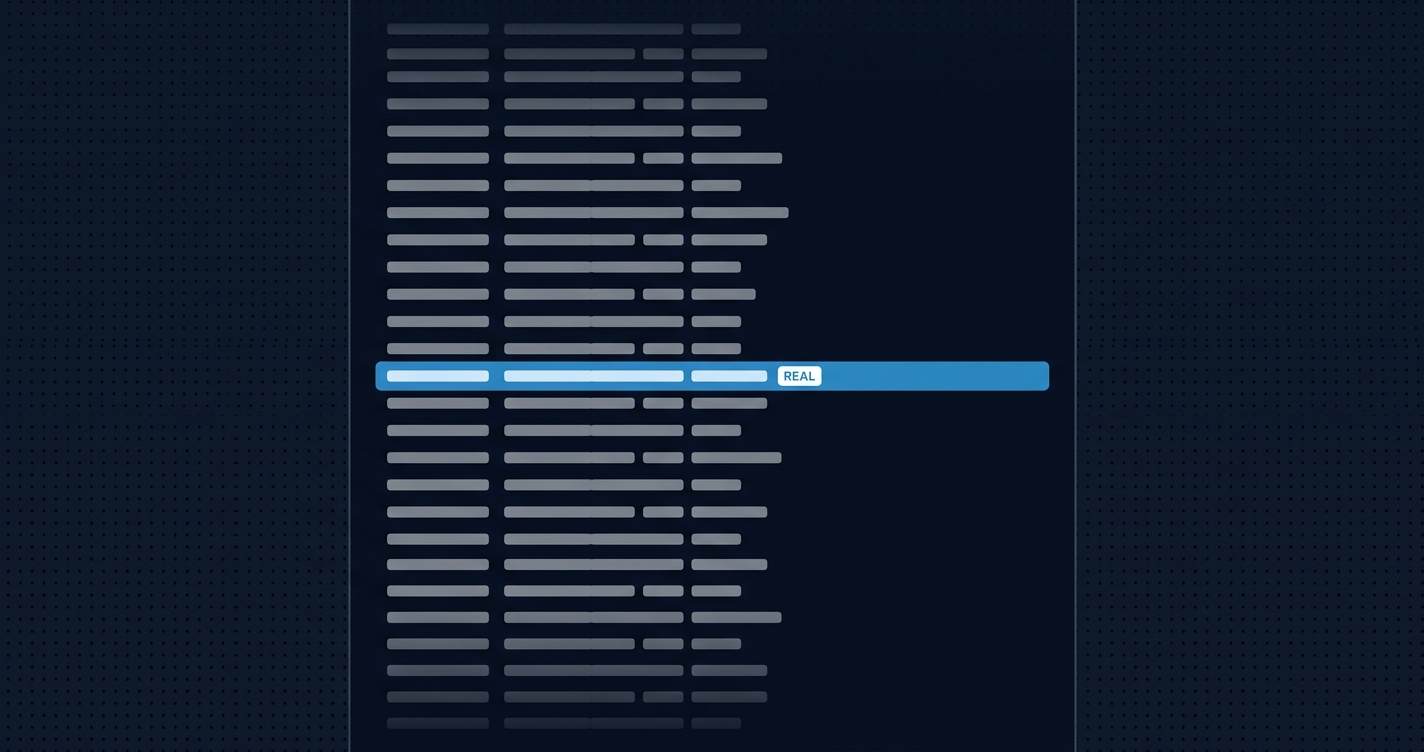
The bottleneck in smart contract security is not detection. It is interpretation. You finish a 2,000-line DeFi protocol and run Slither: 87 findings, three hours of triage, and the real bug filed as “probably fine.”
Alarm fatigue is the recognized failure mode where high-volume alerts desensitize analysts, degrading triage accuracy over time. It is not a gap in detection. It is a gap in interpretation.
The false positive rate is the real bottleneck
Automated smart contract security tools catch most known vulnerability classes. Reentrancy detection in Slither is reliable for canonical patterns. Integer overflow in Solidity 0.8+ is largely handled at the compiler level. Access control bypasses at the function level are well-mapped.
The problem is what those tools produce around the real findings.
Industry data from 2026 tooling reviews puts raw scanner output at 40 to 90 findings per 1,000 lines of code.1 Of those, fewer than 10% survive triage as genuine high or medium severity issues.1 That ratio means an auditor reviewing a 2,000-line contract can expect roughly 80 to 180 warnings, with somewhere between 8 and 18 real ones buried inside.
The effect is predictable. Security teams exposed to high-volume, low-quality alerts become desensitized. Each new warning gets less attention than the last. Auditors build gut heuristics: “this pattern is usually fine,” “we see this all the time, it is a false positive.” Those heuristics work well on average. They fail on the outlier, the one finding that looks routine but is not.
This is alarm fatigue. It is a recognized failure mode in cybersecurity and medicine, and it has received almost no formal study in smart contract auditing. The signal exists. The problem is acting on it correctly.
What scanners are actually good at
Automated tools do succeed. The category just needs to be stated precisely.
Static analysis detects implementation bugs reliably: reentrancy via AST pattern matching, delegatecall to untrusted addresses, unchecked return values, storage collision in proxy patterns.2 These are syntactic bugs. The bug manifests as a code structure or a provable constraint violation. The tool does not need to understand business logic. It pattern-matches against a known-bad database.
Symbolic execution (Mythril, Halmos) finds constraint violations across every execution path: integer overflow, assertion failures, access control gaps where a function is callable without the expected precondition. This works because the properties being checked (“this value cannot overflow,” “this require must always pass”) are expressible formally without domain knowledge.
Fuzzing (Echidna, Medusa) is accurate when your invariants are accurate.3 Write a correct invariant, and the fuzzer finds inputs that violate it.
The unifying characteristic: these tools work on properties that can be stated without understanding what the contract is supposed to do. They produce reliable output for that category. They struggle everywhere else, either flagging nothing (false confidence on logical bugs) or flagging something suspicious they cannot classify correctly (contributing noise to the triage queue).
What a 100-developer study found
A March 2026 paper from Fattahdizaji, Pishdar, and Shukur introduces SmartGraphical, a framework that targets the alarm fatigue problem directly.4
As Fattahdizaji et al. write, “the integration of visual abstraction into static analysis workflows enables developers of all experience levels to classify warnings with higher accuracy, with the most pronounced gains observed among junior auditors who lack the contextual mental models required for reliable triage.”4
The central claim is not that SmartGraphical detects more bugs than Slither. It is that human auditors triage automated warnings significantly more accurately when they have visual context than when they have raw warning output.
The framework has three components:
- Pattern-driven static analysis surfaces candidate warnings the same way existing tools do.
- Visual abstraction renders the contract architecture alongside each warning: control flow graphs showing function sequences and conditional branches, state transition diagrams mapping how contract state moves across operations, data dependency graphs, and call hierarchy visualizations tracing cross-contract function paths.
- Human analysts review each warning in the context of the visualization, applying domain knowledge to determine whether the warning is real.
Validated across 100 developers at varying expertise levels, the visual interface produced higher detection rates and lower false positive rates than the same auditors reviewing raw scanner output.
The expertise gap finding is the most striking result. Junior developers reviewing raw Slither output frequently dismiss real warnings because they lack the mental model to evaluate them in context. The same developers reviewing a warning overlaid on a state transition diagram classified warnings correctly at rates approaching senior developers. Visual context makes senior-level triage judgment transferable to people who do not have it yet. That is a genuinely useful property.
What the state transition diagram reveals
The SYFI rebase failure illustrates why visual context changes triage, not just detection.
We covered SYFI earlier in the context of logical bugs. The short version: a state manipulation vulnerability in the token minting mechanism that Slither and Mythril both missed. What that analysis did not explore is what SmartGraphical’s state transition diagram made visible that code inspection did not.
The diagram for the SYFI minting path exposed something that looks innocuous in code: a transition out of Rebasing state that could be triggered while the previous rebase’s accounting was still mid-settlement. Each individual function call looks correct in isolation. In the state diagram, the transition sequence shows a window where contract state is internally inconsistent, rebase applied, settlement not complete, and the minting path still accessible.
An auditor reviewing a raw “suspicious state write” warning in claimRewards() has no way to evaluate whether it matters without knowing where that write falls in the contract’s lifecycle. The auditor looking at a state diagram where that write falls on a transition from Deposited toward Settled (with a branch showing that claimRewards() is reachable before Settled is confirmed) has an unambiguous classification.
The flash swap case study follows the same logic. A flash swap moves liquidity temporarily: balance increases without a corresponding deposit, a dependent operation executes, balance returns in the same block. Automated tools generate balance manipulation warnings. Those warnings look identical whether the manipulation is a legitimate flash loan hook or a genuine exploit vector. The state transition diagram for a flash swap attack has a recognizable shape: a loop where balance rises, an operation executes, and balance returns, without a settlement checkpoint that should be there. The loop is unambiguous in the diagram. The same warning without the diagram is not.
Adjusting your triage workflow
SmartGraphical’s research implies something portable: auditors triage more accurately when they can see the system’s structure, not just its warnings. This does not require adopting any specific tool. It requires changing the sequence of how audit work gets done.
-
Visualize before you triage. Generate call graphs and state machine representations before opening the scanner output. Slither’s
--print call-graphand--print cfgproduce these in a few minutes. The mechanics are in the visualization audit post. Build the structural map before reading the warning list. A warning list without a map is sorted noise. -
Organize warnings by location in the system, not by severity score. A high-severity warning on an isolated, read-only function touches less attack surface than a medium-severity warning at a state transition boundary. Severity scores from automated tools are calculated without structural context. Reviewing them without structural context reproduces the same blindspot the tools have.
-
Map the state machine explicitly before writing the finding list. For any contract with meaningful state: document the valid states, the transitions between them, and which functions trigger each transition. Then locate each warning in that map. Warnings that fall at or near transition boundaries warrant the most scrutiny. Warnings on paths that do not touch state transitions are the ones most likely to be noise.
None of this replaces automated scanning. The tools catch real bugs and should run first. The change is in how the output gets processed: with structural context, against a system map, not against a flat list sorted by severity.
After deployment: the same problem, different data
Pre-deployment, the interpretability problem is about scanner warnings. Post-deployment, it is the same problem with a different input: transaction traces.
When a contract behaves unexpectedly on mainnet, a raw event log produces an alarm fatigue effect identical to a flat warning list. Individual events are ambiguous. The question “is this normal behavior or the beginning of an exploit?” requires seeing the sequence: which functions were called, in what order, with what state changes at each step.
Block explorer call traces provide structural context for deployed contracts. An Ethernal trace shows the complete execution tree for any transaction: decoded function calls, internal messages, state changes at each step. A flash swap attack in a raw event log looks like noise. In a decoded call trace, the shape (borrow, execute, repay, all within the same block, with a state that should not be reachable mid-sequence) is the same loop that SmartGraphical’s diagram makes visible pre-deployment.
The interpretability insight is the same at both stages: raw data needs structural context before it becomes something you can act on correctly.
The bottleneck is interpretation, not detection
Smart contract security tooling has largely solved detection for known patterns. Reentrancy, overflow, function-level access control: these are caught reliably. The exploits that drain protocols now are predominantly logical and semantic, in territory the tools do not reach.
SmartGraphical’s contribution is not another detection approach. It is empirical evidence, from a 100-developer study, that the harder problem is not finding the signal. It is making the signal interpretable enough that auditors consistently act on it correctly.
The fix is structural: visualize before you triage. Map the state machine before you read the warning list. Let the shape of the contract show you which warnings actually matter.
References
1. Pharos Production. “State of Smart Contract Audits 2026.” pharosproduction.com, 2026. https://pharosproduction.com/insights/engineering/state-of-smart-contract-audits-2026/
2. Feist, J., Grieco, G., Groce, A. “Slither: A Static Analysis Framework For Smart Contracts.” IEEE/ACM 2nd International Workshop on Emerging Trends in Software Engineering for Blockchain (WETSEB), 2019.
3. Grieco, G., Song, W., Cygan, A., Groce, A. “Echidna: Effective, Usable, and Fast Fuzzing for Smart Contracts.” ACM SIGSOFT International Symposium on Software Testing and Analysis (ISSTA), 2020.
4. Fattahdizaji, A., Pishdar, M., Shukur, Z. “SmartGraphical: A Human-in-the-Loop Framework for Detecting Smart Contract Logical Vulnerabilities via Pattern-Driven Static Analysis and Visual Abstraction.” arXiv, March 9, 2026. https://arxiv.org/abs/2603.08580v1